UK landlord insurance statistics 2026
With an estimated 2.8 million landlords in the UK, buy-to-let properties are a popular way of generating additional income and a financial investment for the future.
31.03.26

- Median cost of landlord insurance in the UK 2026
- Median cost of landlord insurance in the UK by property type
- Median cost of UK landlord insurance by number of bedrooms
- Median cost of landlord insurance in the UK by age of property
- Median cost of landlord insurance in the UK by property value
- Median cost of landlord insurance by UK region
- Median cost of landlord insurance in the UK by tenant type
- Factors that affect landlord insurance costs in the UK
- Our landlord survey
- Landlord insurance FAQs
In this article
- Median cost of landlord insurance in the UK 2026
- Median cost of landlord insurance in the UK by property type
- Median cost of UK landlord insurance by number of bedrooms
- Median cost of landlord insurance in the UK by age of property
- Median cost of landlord insurance in the UK by property value
- Median cost of landlord insurance by UK region
- Median cost of landlord insurance in the UK by tenant type
- Factors that affect landlord insurance costs in the UK
- Our landlord survey
- Landlord insurance FAQs
However, it’s estimated that around 14% of landlords do not have specialist landlord cover in place. This means almost 400,000 landlords could be exposed to potentially large expenses further down the line, should they need to pay for repairs to the building or the replacement of items.
An estimated 400,000 UK landlords don’t have specialist landlord insurance.
Alan Boswell Group
Landlord insurance provides financial protection for homeowners who rent property out to tenants. In short, it helps cover the increased risks associated with letting properties out to those in rented accommodation.
Our landlord insurance report collates recent UK landlord insurance statistics, alongside our own data, to see how the market is changing. By analysing landlord insurance stats across different variables, we can assess the extent to which various factors could impact the average cost of landlord insurance in 2026.
Our top six UK landlord insurance statistics for 2026
The median cost of landlord insurance in the UK in 2026 is £284.75, a benchmark figure for the nearly 2.7 million private landlords navigating an increasingly complex rental market.
An estimated 400,000 UK landlords are operating without any insurance, leaving properties worth hundreds of thousands of pounds exposed to potentially devastating financial risk.
Britain's rental market is dominated by terraced houses, with 49% of all landlord insurance quotes for terraced properties at a median of £269 a year, making them the single most insured property type in the UK.
Owning a Victorian rental property costs landlords £424 a year to insure, 81% more than the £234 paid by landlords with a 1990s property, a hidden annual penalty for Britain's period property investors.
Every bedroom adds to a landlord's insurance bill, with a five-bed rental costing £425 a year to insure, 52% more than the £279 paid for a three-bed.
Despite modern construction, post-2000 properties cost £275 a year to insure, more than homes built in the 1980s (£231) or 1990s (£234), suggesting the new build premium doesn't stop at the purchase price.

Quick quote technology
Click the link below to get a quick idea of the price for insuring your property. Using a combination of our own data and public property information, we can provide an indicative price based on just your property address.
Quick quotes are intended to be an estimate, and actual quotes may vary depending on the accuracy and age of your property’s EPC data.
Median cost of landlord insurance in the UK 2026
The median average cost of landlord insurance in the UK in 2026 is £284.75. This is for landlord insurance with no optional extras, and takes into account all property types, locations, and tenant types in the UK.
The average cost of UK landlord insurance in 2026 is £284.75.
Alan Boswell Group
Median cost of landlord insurance in the UK by property type
Based on quote data, a Tyneside flat is the cheapest type of property for landlord insurance, with an average price of £187.53.
Other types of property that are relatively affordable for landlord insurance include:
Bungalow - Semi Detached (£252.47)
Flat - Individual (Purpose Built) (£255.44)
A breakdown of median landlord insurance costs by type of property

Property type |
Median |
% of total quotes |
|---|---|---|
House - Terraced |
£269.47 |
49.14% |
House - Semi-Detached |
£280.00 |
19.91% |
Flats - Block (Conversion) |
£714.07 |
8.54% |
House - Detached |
£364.29 |
6.48% |
Flat - Individual (Purpose Built) |
£255.44 |
6.26% |
Bungalow - Detached |
£311.07 |
2.42% |
Flats - Block (Purpose Built) |
£822.84 |
1.75% |
Bungalow - Semi Detached |
£252.47 |
1.63% |
Flat - Individual (Conversion) |
£284.05 |
1.38% |
Tyneside Flat |
£187.53 |
0.79% |
As expected, at the other end of the scale, the most expensive landlord insurance is the purpose-built block of flats, where multiple properties are covered. With an average quote of £822.84 per year, this is 339% more expensive than the most affordable option (Tyneside flat).
On average, landlord insurance is also relatively high for converted blocks of flats and detached housing, with typical quotes ranging from £714.07 to £364.29, respectively.
In total, the most common type of quote for landlord insurance was for terraced housing. Accounting for almost half (49.14%) of quotes, the average cost of landlord insurance for this type of property was £269.47 a year.
Recently become a landlord?
If you are a new landlord, or thinking of becoming one, then check out our beginners guide to landlord insurance. It lists all the important aspects landlords should be aware of when starting out.
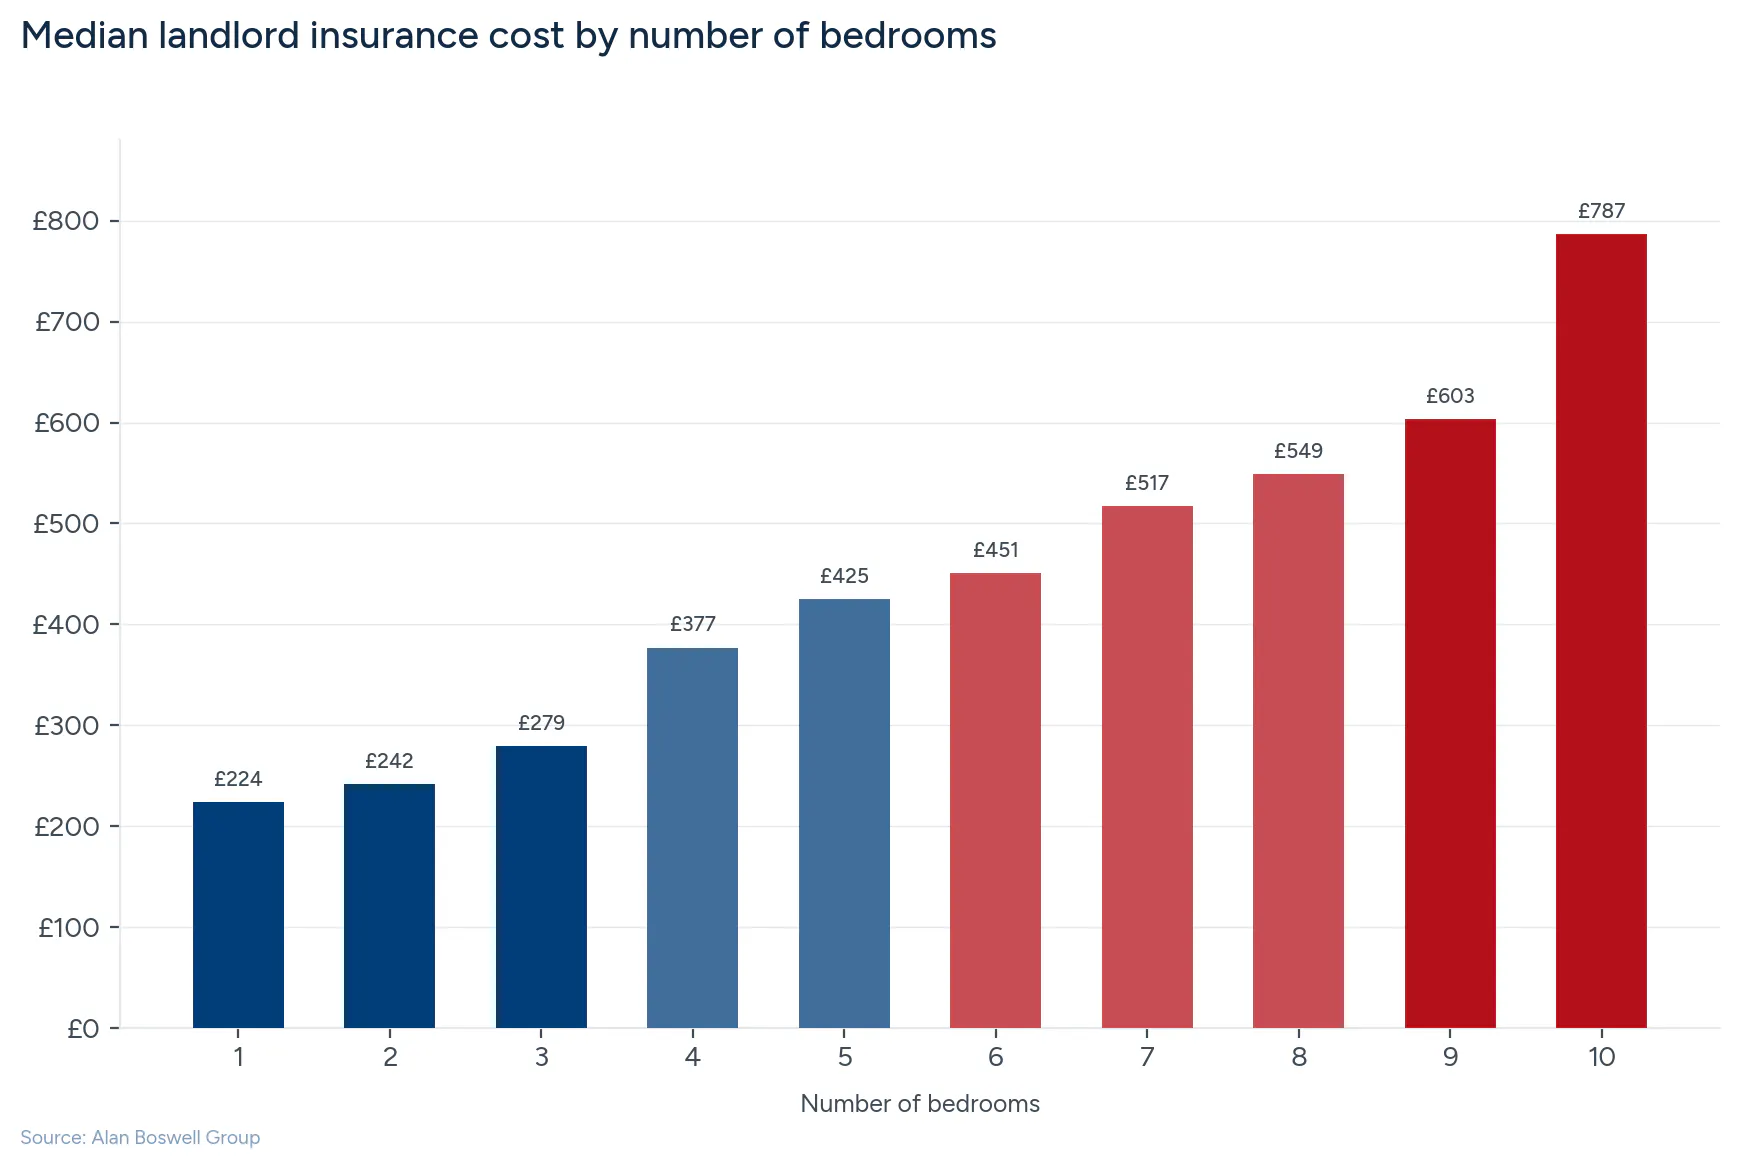
Median cost of UK landlord insurance by number of bedrooms
Another factor that affects the cost of landlord insurance is property size. Generally, properties with fewer bedrooms tend to generate cheaper landlord insurance quotes.
According to our quote-based data, one-bedroom properties tend to have the lowest landlord insurance costs. On average, this will set you back around £224 for the year.
The most popular property size for landlord insurance quotes is three-bedroom (41.09%), followed by two-bedroom properties (34.38%). A two-bedroom property will cost 8% more to insure than a one-bedroom property. For a three-bedroom property the price increases once again, this time by £37.
A breakdown of median landlord insurance costs by house size
Bedrooms |
Median |
% of total quotes |
|---|---|---|
1 |
£224.00 |
5.81% |
2 |
£242.00 |
34.38% |
3 |
£279.10 |
41.09% |
4 |
£377.03 |
9.98% |
5 |
£424.74 |
4.15% |
6 |
£451.00 |
3.12% |
7 |
£517.47 |
0.79% |
8 |
£549.00 |
0.40% |
9 |
£603.39 |
0.11% |
10 |
£787.00 |
0.09% |
On average, a four-bedroom property costs 35% more to insure than a three-bedroom, and around 68% more than a one-bed property.
Typically, the most expensive property size for landlord insurance is one with ten bedrooms. With an average quote of £787, this is over 30% more than the cost to insure a nine-bedroom property.
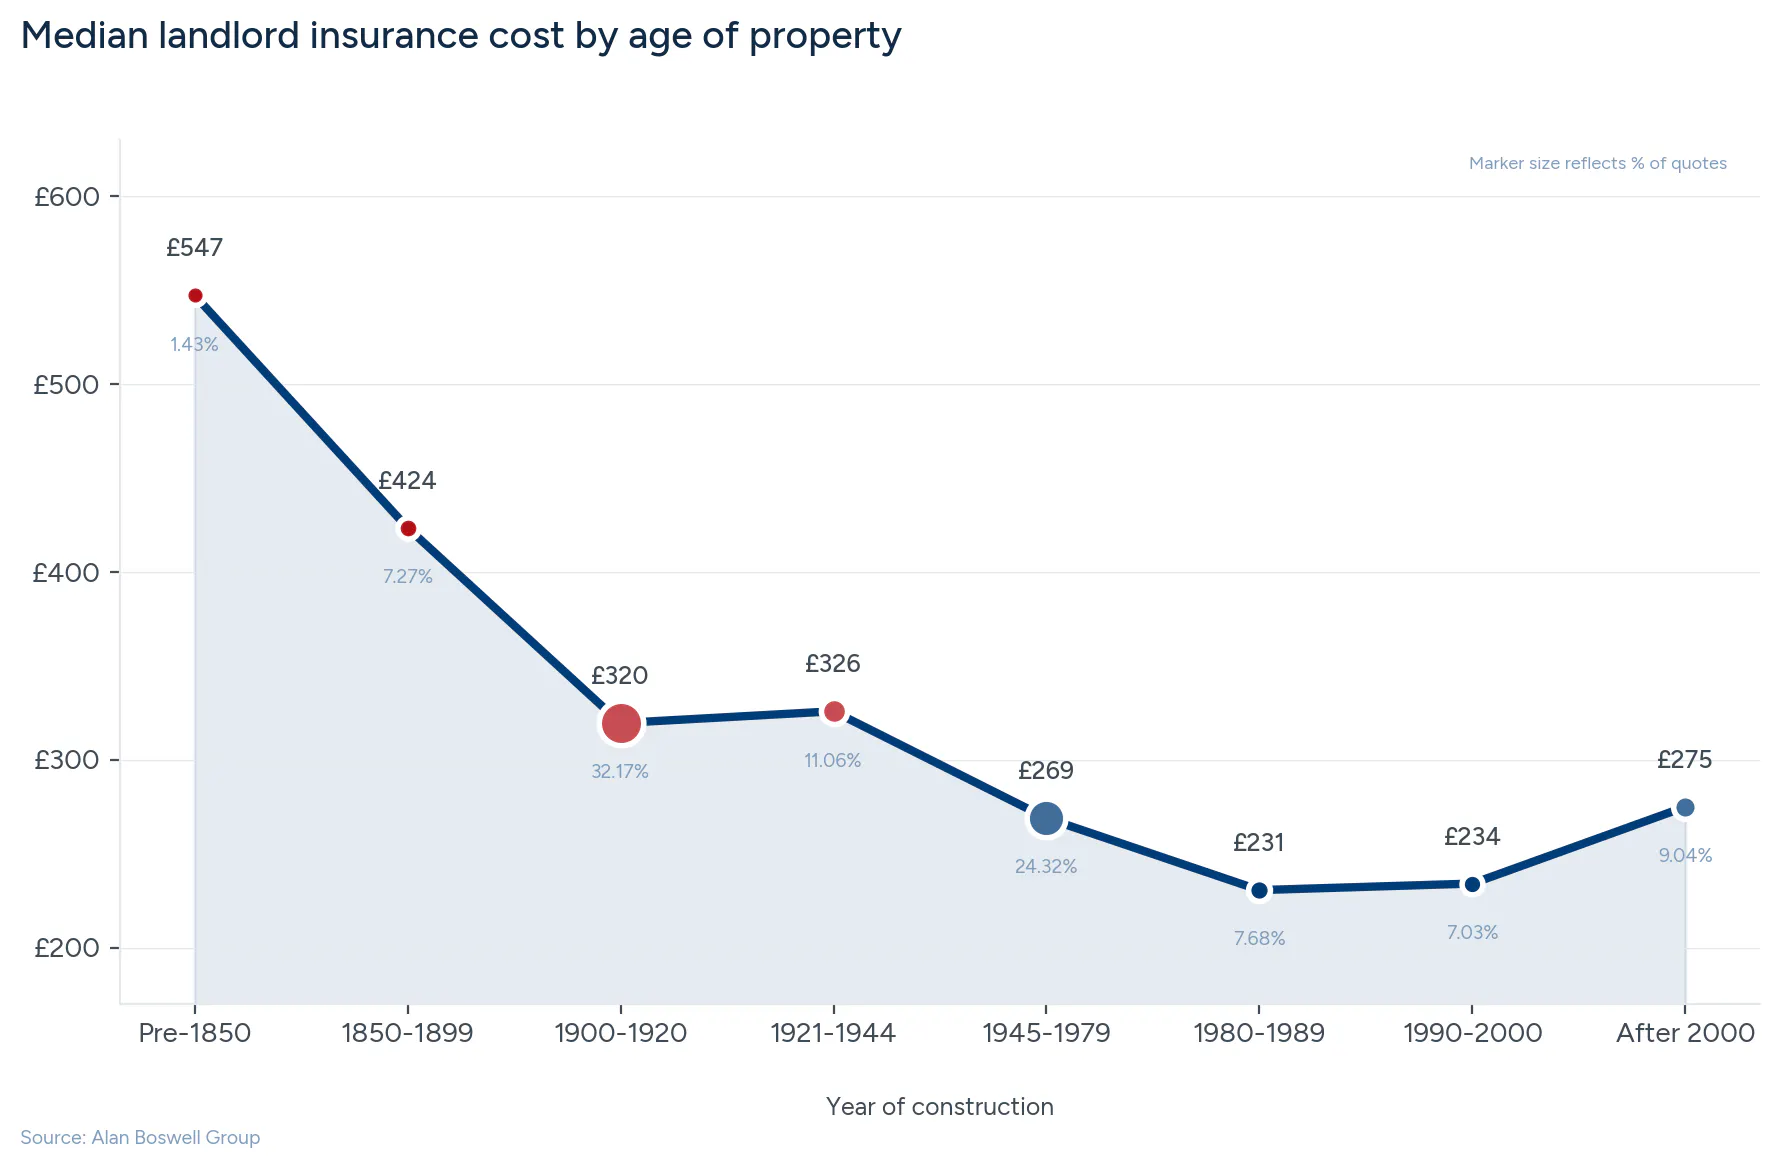
Median cost of landlord insurance in the UK by age of property
Our landlord insurance statistics show that newer properties tend to yield cheaper insurance costs.
Typically, properties built between 1980-1989 have the lowest average landlord insurance costs. At £231 for a typical quote, this is just over £3 a year cheaper than the next most affordable options (properties built between 1990-2000).
A breakdown of median landlord insurance costs by year of construction
Year |
Median |
% of total quotes |
|---|---|---|
Pre-1850 |
£547.35 |
1.43% |
1850-1899 |
£423.56 |
7.27% |
1900-1920 |
£319.60 |
32.17% |
1921-1944 |
£325.85 |
11.06% |
1945-1979 |
£269.00 |
24.32% |
1980-1989 |
£230.65 |
7.68% |
1990-2000 |
£234.12 |
7.03% |
After 2000 |
£275.00 |
9.04% |
According to our quote-based data, properties built between 1900-1920 are the most common property age for landlord insurance quotes.
The average price of landlord insurance drops significantly for properties built after the Second World War. Those constructed between 1945-1979 cost around 17% less on average to insure than a typical property built between 1921 and 1944 and contribute to almost a quarter of total quotes (24.32%).
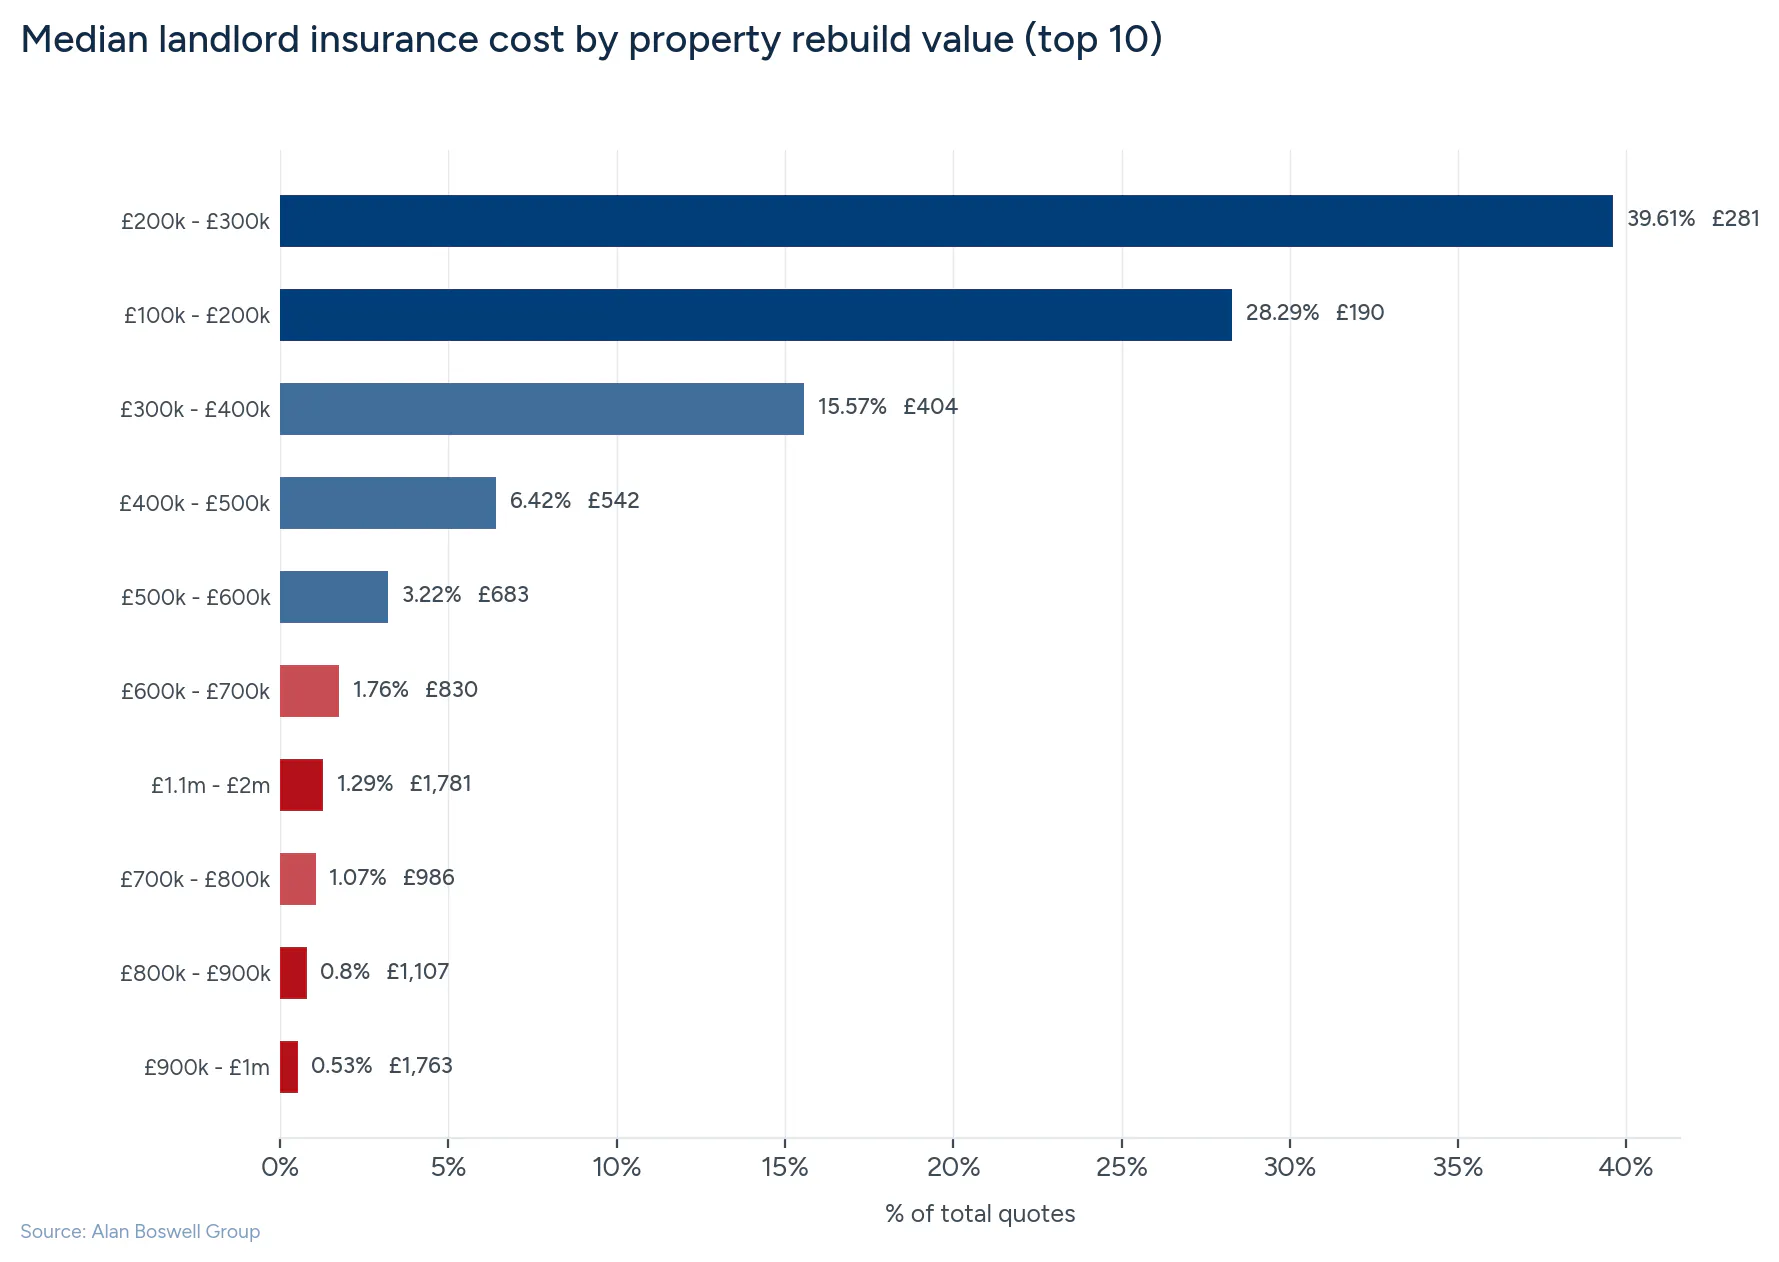
Median cost of landlord insurance in the UK by property value
Our latest landlord insurance statistics show that as a property's rebuild value (RV) increases, so does the relative cost of landlord insurance.
Over two-thirds (68%) of our landlord insurance quotes are for properties with a rebuild value of between £100,001 and £300,000, generating median prices of £189.95 and £280.71, respectively.
The average cost of landlord insurance is lowest for properties under £100,000 RV (median £112), although this accounts for less than 1% of our total quotes.
The rebuild value (RV) refers to how much it would cost to rebuild your property if it was destroyed beyond repair. This includes the price of site clearance, labour, and materials.
A breakdown of average landlord insurance costs by rebuild value of property
Property rebuild vaule |
Median quote price |
Percentage of total quotes |
|---|---|---|
£1 - £100,000 |
£112.00 |
0.37% |
£100,001 - £200,000 |
£189.95 |
28.29% |
£200,001 - £300,000 |
£280.71 |
39.61% |
£300,001 - £400,000 |
£404.28 |
15.57% |
£400,001 - £500,000 |
£541.91 |
6.42% |
£500,001 - £600,000 |
£683.00 |
3.22% |
£600,001 - £700,000 |
£830.12 |
1.76% |
£700,001 - £800,000 |
£985.77 |
1.07% |
£800,001 - £900,000 |
£1,106.70 |
0.80% |
£900,001 - £1,000,000 |
£1,763.00 |
0.53% |
£1,000,001 - £1,100,000 |
£1,330.21 |
0.44% |
£1,100,001 - £2,000,000 |
£1,781.00 |
1.29% |
£2,000,001 - £3,000,000 |
£2,828.20 |
0.39% |
£3,000,001 - £4,000,000 |
£3,849.64 |
0.12% |
£4,000,001 - £5,000,000 |
£4,599.00 |
0.06% |
£5,000,001 - £6,000,000 |
£5,486.81 |
0.03% |
£6,000,001+ |
£6,944.00 |
0.02% |
At the other end of the scale, once the rebuild value of a property exceeds £900,000, but is less than £1million, this results in a median landlord insurance cost of around £1,763 per year.
Typically, the highest median landlord insurance costs can be found on properties with a rebuild value over £6 million, around £6,944 per year.
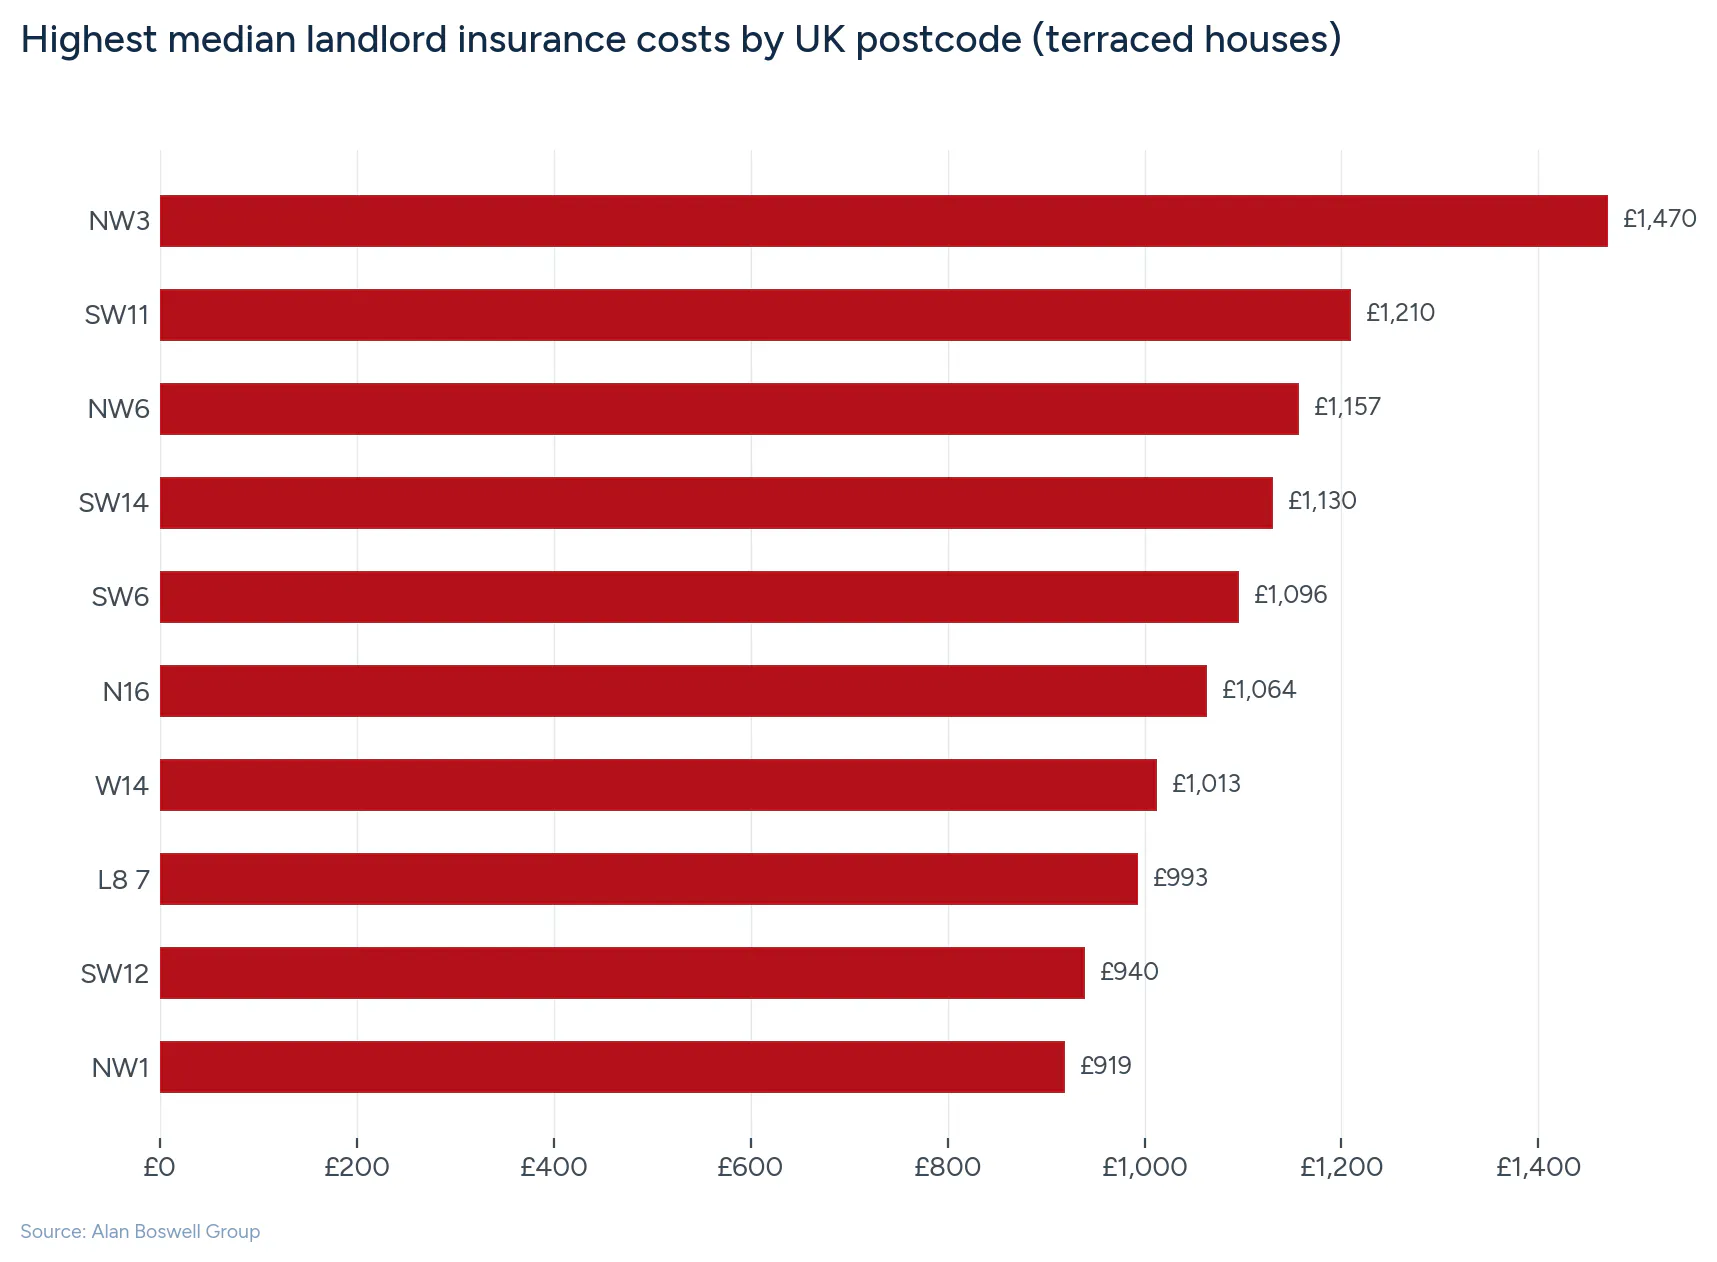
Median cost of landlord insurance by UK region
Across the UK, there are significant variations in the average cost of landlord insurance, ranging from as little as £73 a year, up to more than £1,470.
Based on our quote data for terraced houses — the most common property type, accounting for 49% of all quotes — the price of landlord insurance in the UK tends to be highest in London and the south, and less expensive towards the midlands and north. However, there are areas across the country where the average cost varies significantly depending on your personal circumstances and the type of property being insured.
A breakdown of the highest median landlord insurance costs by UK postcode
The following postcode data is based on quotes for terraced houses only.
Postcode |
Median quote value |
|---|---|
NW3 |
£1,470.31 |
SW11 |
£1,210.00 |
NW6 |
£1,157.14 |
SW14 |
£1,130.00 |
SW6 |
£1,096.35 |
N16 |
£1,063.83 |
W14 |
£1,013.00 |
L8 7 |
£993.00 |
SW12 |
£939.91 |
NW1 |
£918.95 |
According to our quote-based data, the most expensive area of the UK for terraced house landlord insurance is in the NW3 postcode. Situated in the Hampstead area (London), the average price of landlord insurance here is £1,470 a year.
This is followed by SW11 and NW6 postcodes, which have average landlord insurance costs of £1,210 and £1,157, respectively.
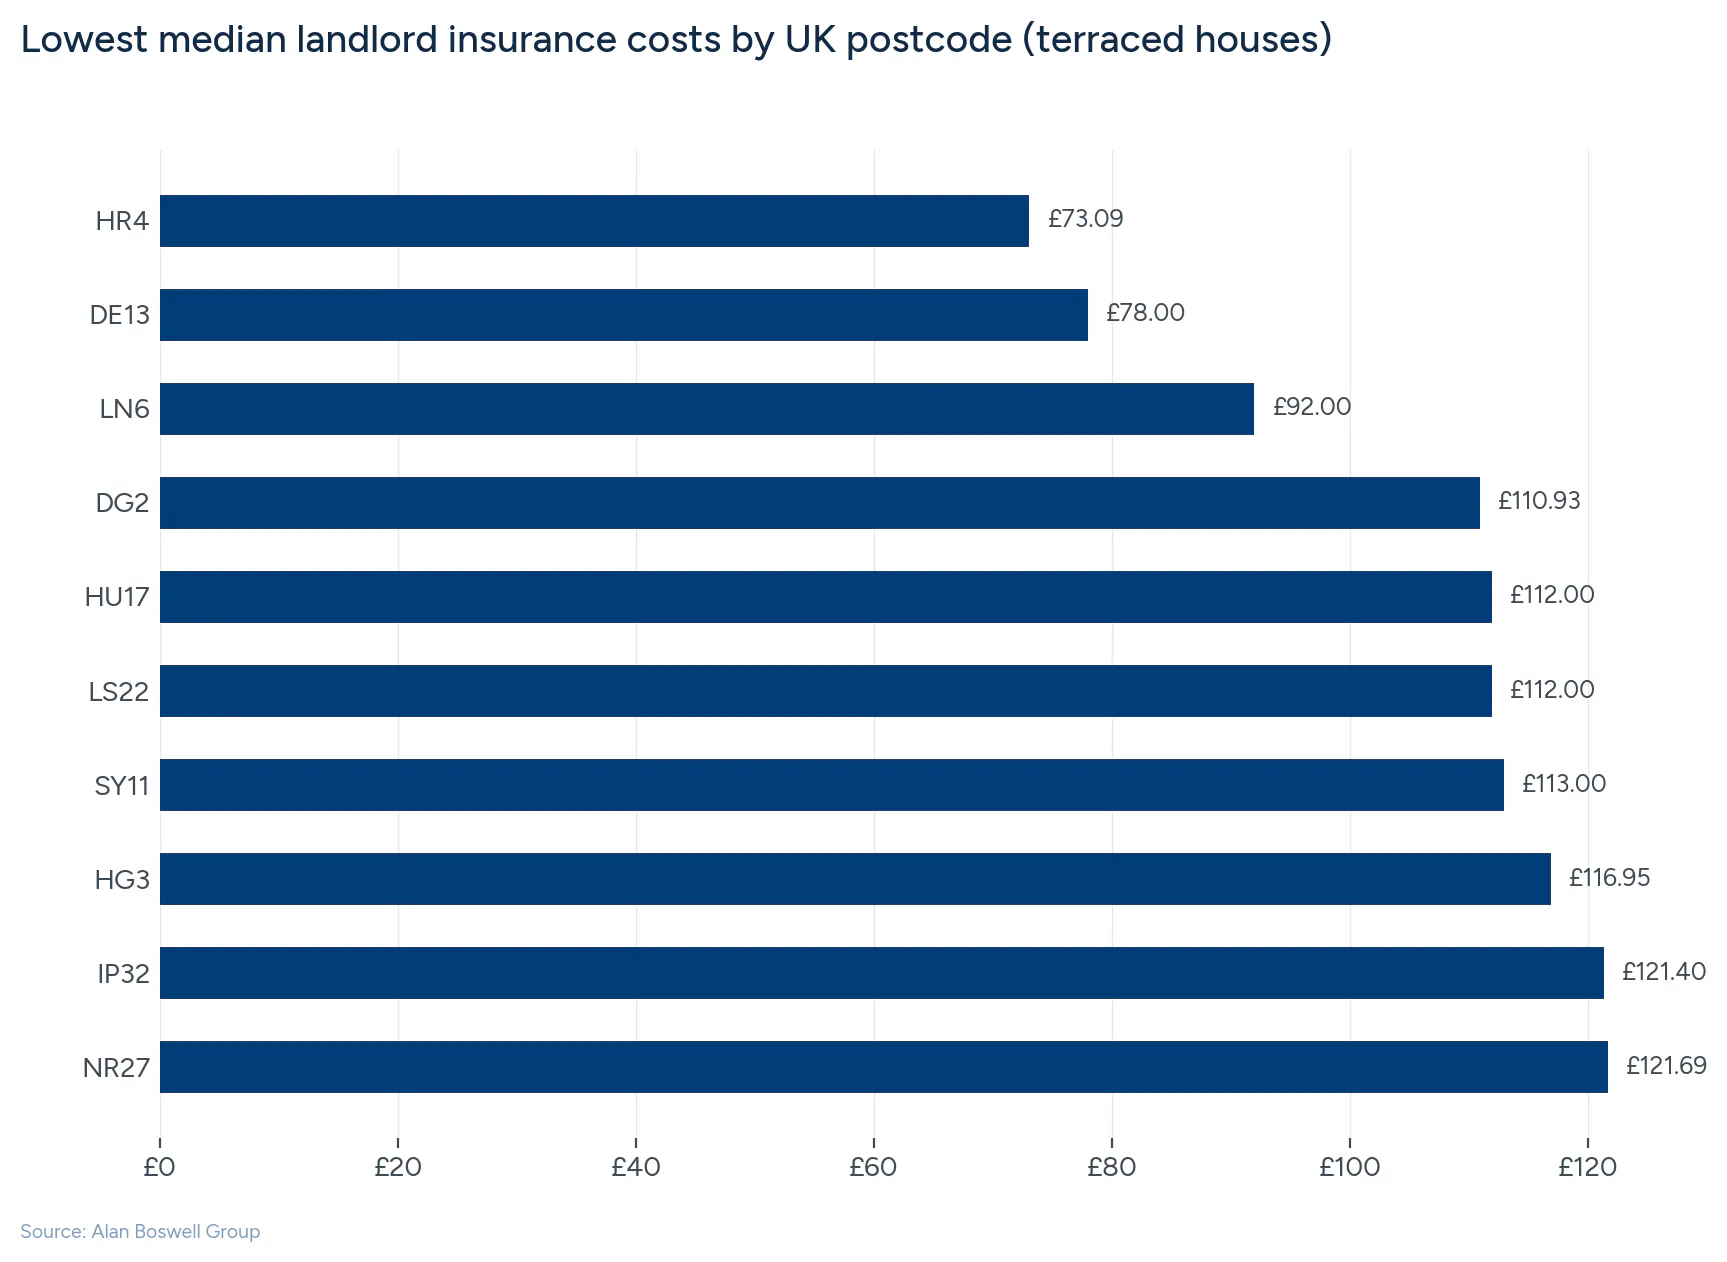
A breakdown of the lowest median landlord insurance costs by UK postcode
The following data is based on quotes for terraced houses only.
Postcode |
Median quote value |
|---|---|
HR4 |
£73.09 |
DE13 |
£78.00 |
LN6 |
£92.00 |
DG2 |
£110.93 |
HU17 |
£112.00 |
LS22 |
£112.00 |
SY11 |
£113.00 |
HG3 |
£116.95 |
IP32 |
£121.40 |
NR27 |
£121.69 |
The most affordable part of the country for terraced house landlord insurance is located in the postcode area HR4. Property owners in the Hereford area had an average quote price of £73.09 for their landlord insurance. This was ahead of DE13 - this area of Burton upon Trent has an average cost of £78 for landlord insurance per year.
LN6 (Lincoln) is the only other postcode area of the country to experience average terraced house landlord insurance costs of less than £100 a year.
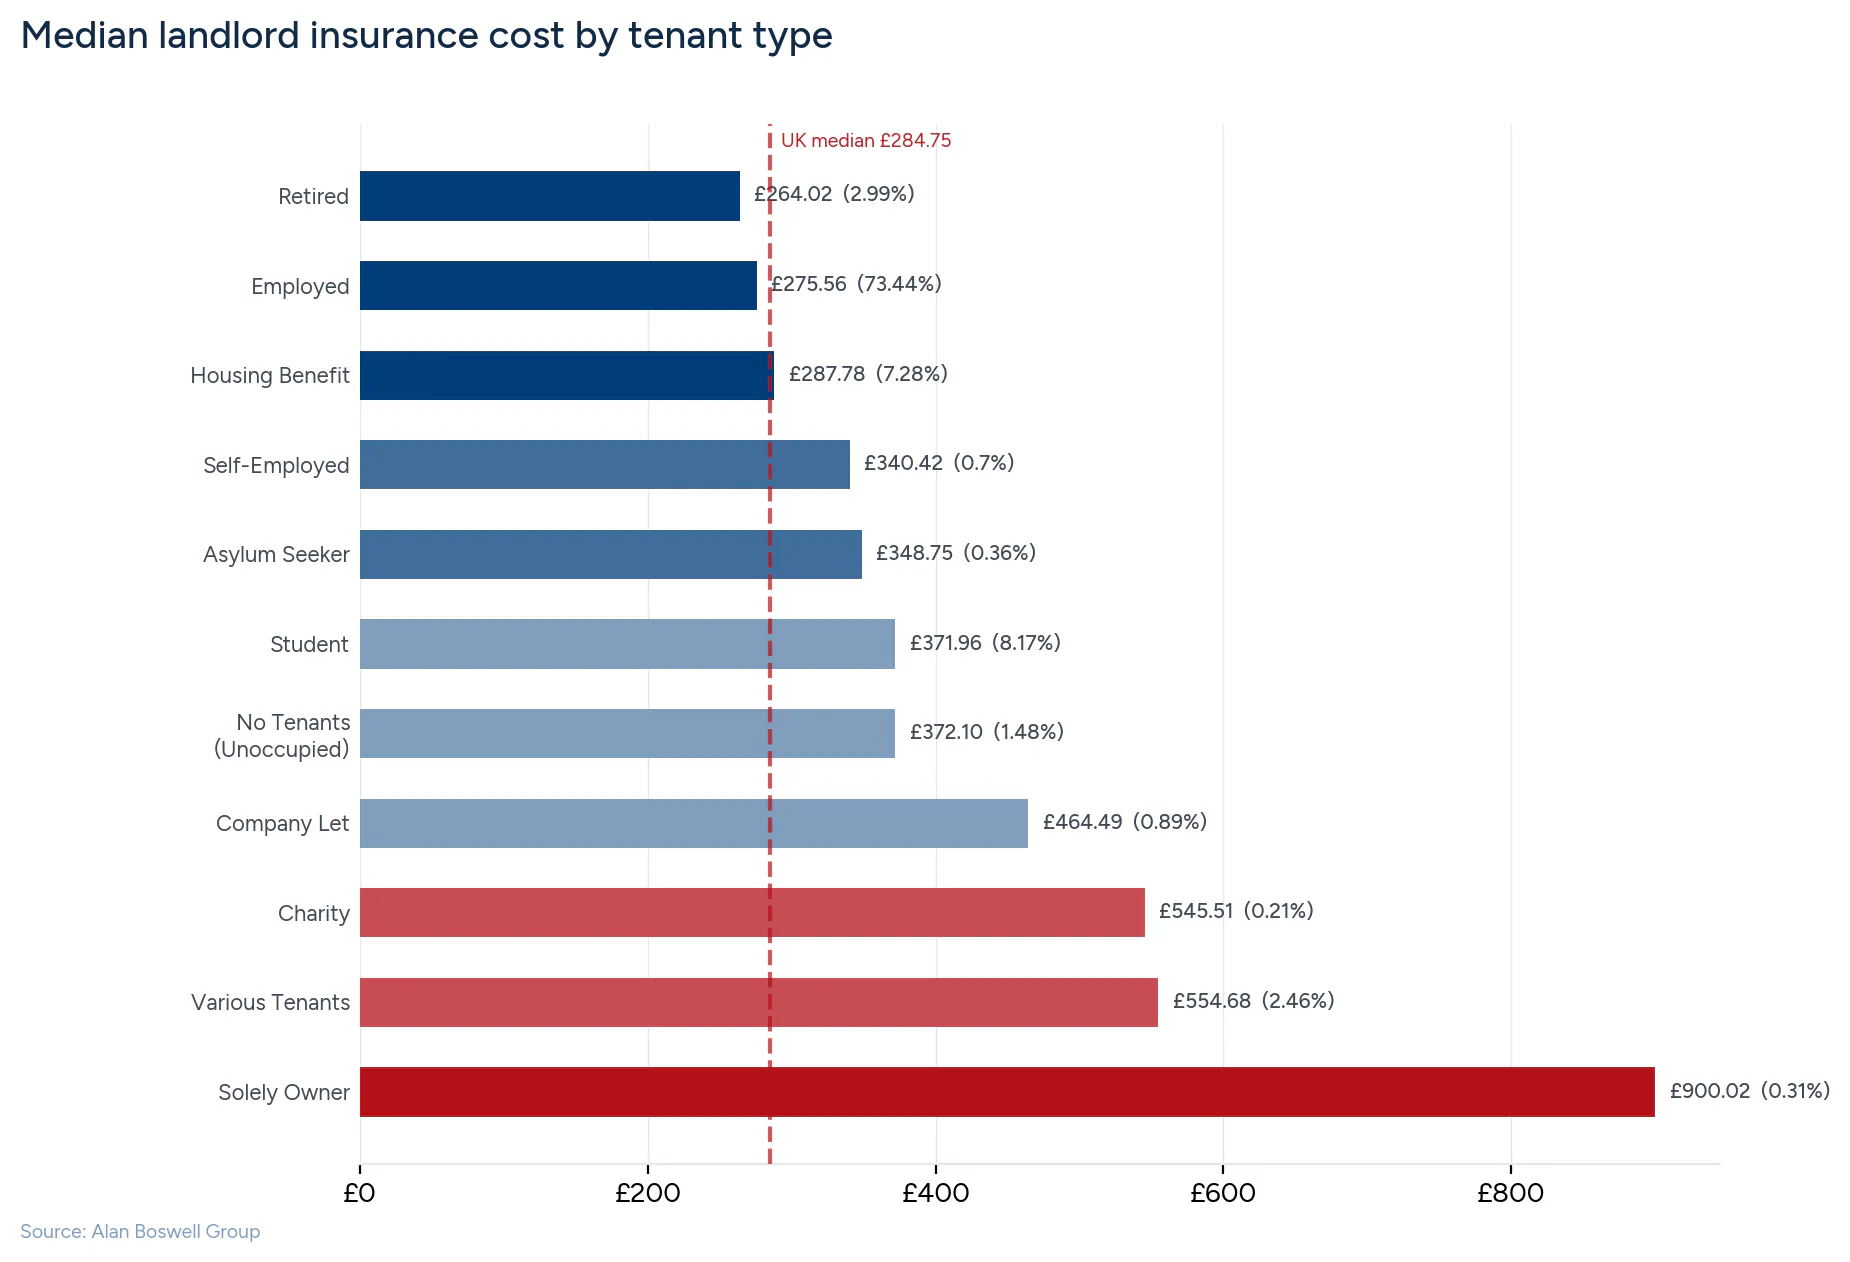
Median cost of landlord insurance in the UK by tenant type
According to our quote-based landlord insurance statistics, the lowest average cost of landlord insurance is for those renting to the retired (£264.02), followed by the employed (£275.56), although employed tenants account for the vast majority of quotes.
Properties with residents on housing benefits face average landlord insurance costs of £288 a year, compared to £340.42 for those who are self-employed.
A breakdown of average landlord insurance costs by type of occupant
Tenant Type |
Median average quote price |
Percentage of total quotes |
|---|---|---|
Employed |
£275.56 |
73.44% |
Student |
£371.96 |
8.17% |
Housing benefit |
£287.78 |
7.28% |
Retired |
£264.02 |
2.99% |
Various tenants* |
£554.68 |
2.46% |
No tenants (unoccupied) |
£372.10 |
1.48% |
Company let |
£464.49 |
0.89% |
Self-employed |
£340.42 |
0.70% |
Asylum seeker |
£348.75 |
0.36% |
Solely owner |
£900.02 |
0.31% |
Charity |
£545.51 |
0.21% |
*Properties let to a range of people, usually because they have an HMO, own a large block of flats, or have a rental portfolio.
According to our data, students are the second most popular tenant type (8.17%) after the employed (73.44%). However, the average cost of landlord insurance for renting to students is almost £100 a year more than employed tenants.
In addition, an unoccupied property has a typical cost of £372 per year. This makes them around 35% more expensive for landlord insurance compared to the cheapest tenanted properties. Mixed-tenant properties attract the most expensive landlord insurance after solely-owned properties, with an average cost of £555.
Renting to more than three tenants in the same property?
Then you may want to consider HMO landlord insurance as an alternative to a standard policy, to ensure you are fully protected in the event of a claim.
Which optional extras have the biggest impact on landlord insurance costs in the UK?
The overall cost of landlord insurance will vary depending on which optional extras you choose to include. For example, landlord legal expenses insurance (with up to £100,000 worth of cover) could set you back an extra £60 per tenancy.
Optional extra cover for landlords |
When purchased with landlord insurance |
When purchased as a standalone item |
|---|---|---|
Accidental damage (building only) |
Built into the rate |
Not able to purchase |
Legal expenses (£50k cover) |
£60 |
£80 |
Tenant default/rent guarantee (£12k to £50k worth of cover) |
£195 |
£250 |
Home emergency (boiler, heating, electric) |
£155 |
£155 |
Similarly, rent guarantee insurance will set you back £195 a year, when purchased alongside landlord insurance, with the cost of adding landlord home emergency cover standing at £155. At the other end of the scale, landlord contents insurance as an add-on could range between £74 and £248 a year, depending on how much landlord cover you require.
Find a policy that is right for you
Check out the range of landlord products we have available, to help find the policy that is right for you and your circumstances.
Factors that affect landlord insurance costs in the UK
There are many factors that can affect the cost of landlord insurance in the UK. Most of these relate to property characteristics, including:
Rebuild costs/estimated value
Year it was built
Whether it is occupied or unoccupied
Types of construction materials used
Type of occupancy (i.e. commercial only, residential only, or mixed-use buildings)
Type of building (i.e. purpose-built, listed property)
Any building/renovation works in progress
Number of properties being covered by the policy
Location
Landlord insurance costs can also be affected by the type of tenants living in the property (i.e., whether they are employed, students, part of a house share, housing association, or local authority).
In addition, the type of landlord insurance you select, along with any policy add-ons, can also influence the cost of landlord insurance.
This may include:
Accidental damage
Cover for fixtures and fittings
Tenant default
Rent protection
Home emergency cover
Got more than one property in your portfolio?
You might want to consider multi property landlord insurance as a way of saving money.
What external factors affect the average cost of landlord insurance in the UK?
Recent landlord insurance statistics indicate that annual growth in landlord insurance costs is expected to continue into 2026. For example, our data shows a 17% increase in single property policies compared to last year.
This is driven by multiple factors, including claims inflation, operating ratios, and direct inflationary costs, which influenced the average price of landlord insurance for consumers across the UK.
Inflation
UK inflation has eased significantly from the peak of 11.1% recorded in October 2022, but price pressures remain embedded in the economy. CPI inflation fell to around 3% in early 2026, down from 3.8% in mid-2025, and is forecast by the Bank of England to return closer to the 2% target during 2026.
Despite this improvement, the cumulative impact of the cost-of-living crisis remains significant. The Office for National Statistics confirms that the period from 2022 to 2024 represented the sharpest sustained squeeze on real household incomes since records began in the 1950s. These pressures continue to affect wage demands, contractor pricing, and the overall cost base faced by insurers.
Cost of materials and labour
Building costs remain a key driver of claims inflation. According to the Building Cost Information Service (BCIS), material prices stabilised during 2024 and early 2025 after falling slightly in 2023. However, the BCIS forecasts that total building costs will rise by around 15% over the five-year period from 2025 to 2030, driven primarily by labour costs rather than materials.
Tender prices are expected to increase by approximately 17% over the same period, reflecting higher wage costs, regulatory compliance, and contractor risk pricing. For insurers, this means higher average repair and reinstatement costs following claims.
Labour costs and shortages
Labour shortages continue to be one of the most persistent structural challenges facing the construction sector. While overall construction output weakened through 2024, labour costs continued to rise.
BCIS data shows that labour remains the primary driver of construction cost inflation. Wage growth has been supported by increases in the National Living Wage and higher employer National Insurance contributions, with labour costs forecast to rise by approximately 15–18% by 2030.
Skills shortages remain particularly acute across both skilled trades and professional roles, limiting capacity and increasing repair times following insured losses. Delays and higher contractor rates increase claims severity, which in turn feeds into landlord insurance pricing.
New construction output
New construction output declined through 2024, with the BCIS reporting a fall of over 4% year-on-year. Growth during 2025 has been modest, with a broader recovery now expected from 2026 onwards as delayed schemes progress and infrastructure and housing activity improve.
Forecasts suggest total new work output could grow by 15–18% between 2025 and 2030, although the recovery is expected to be uneven across sectors. In the short-term, constrained supply continues to put upward pressure on repair and rebuilding costs following claims.
Environmental change
Climate change remains one of the most significant long-term drivers of insurance costs. The Association of British Insurers reports that UK property insurers paid out a record £6.1 billion in property claims during 2025, driven largely by storms, flooding, subsidence, and extreme weather events.
Weather-related property claims alone exceeded £1.2 billion in 2025, a 14% increase on 2024. Flood claims and storm damage claims both rose sharply, while subsidence claims reached record levels following prolonged periods of hot and dry weather.
The combination of more frequent severe weather events and higher repair costs has accelerated claims inflation. For insurers, this increases loss ratios and capital requirements, which ultimately leads to higher premiums for landlords.
Tourism
Inbound tourism continues to recover strongly. VisitBritain forecasts 45.5 million inbound visits to the UK in 2026, with visitors expected to spend £35.7 billion. This represents a growth of 4% in visits and 7% in nominal spending compared to 2025, exceeding pre-pandemic visitor numbers.
This sustained growth is likely to increase demand for short-term and self-catering accommodation, particularly in urban centres and tourist hotspots. As a result, more landlords are entering the short-let market through platforms such as Airbnb.
Landlords operating in this sector should ensure they have appropriate short-term landlord insurance in place, such as Airbnb or serviced accommodation insurance, particularly where hotel-style services like housekeeping are provided alongside cooking and washing facilities.
Our landlord survey
Landlords are exiting the sector. Legislation is the reason.
A survey of 924 UK landlords reveals a sector under mounting pressure, with more than one in four planning to reduce or exit the market entirely over the next two years.
28% plan to reduce or exit
52% cite legislation as top challenge
47% raised rents last year
39% feel unprepared for new rules
The private rented sector is facing one of its most turbulent periods in recent times. Squeezed by rising costs due to the cost-of-living, a wave of incoming legislation, and deepening uncertainty about the future, landlords across the UK are reassessing whether remaining in the market is worth their while. Our new survey data from 924 landlords, collected in 2026, sets a tone for how UK landlords are feeling.
The findings cover areas such as portfolio intentions, profitability, rental pricing, operational challenges, and tenant relationships. The results give a picture of who landlords are, what they are worried about, and where they are headed.
More than a quarter of landlords plan to shrink their portfolio or leave the market
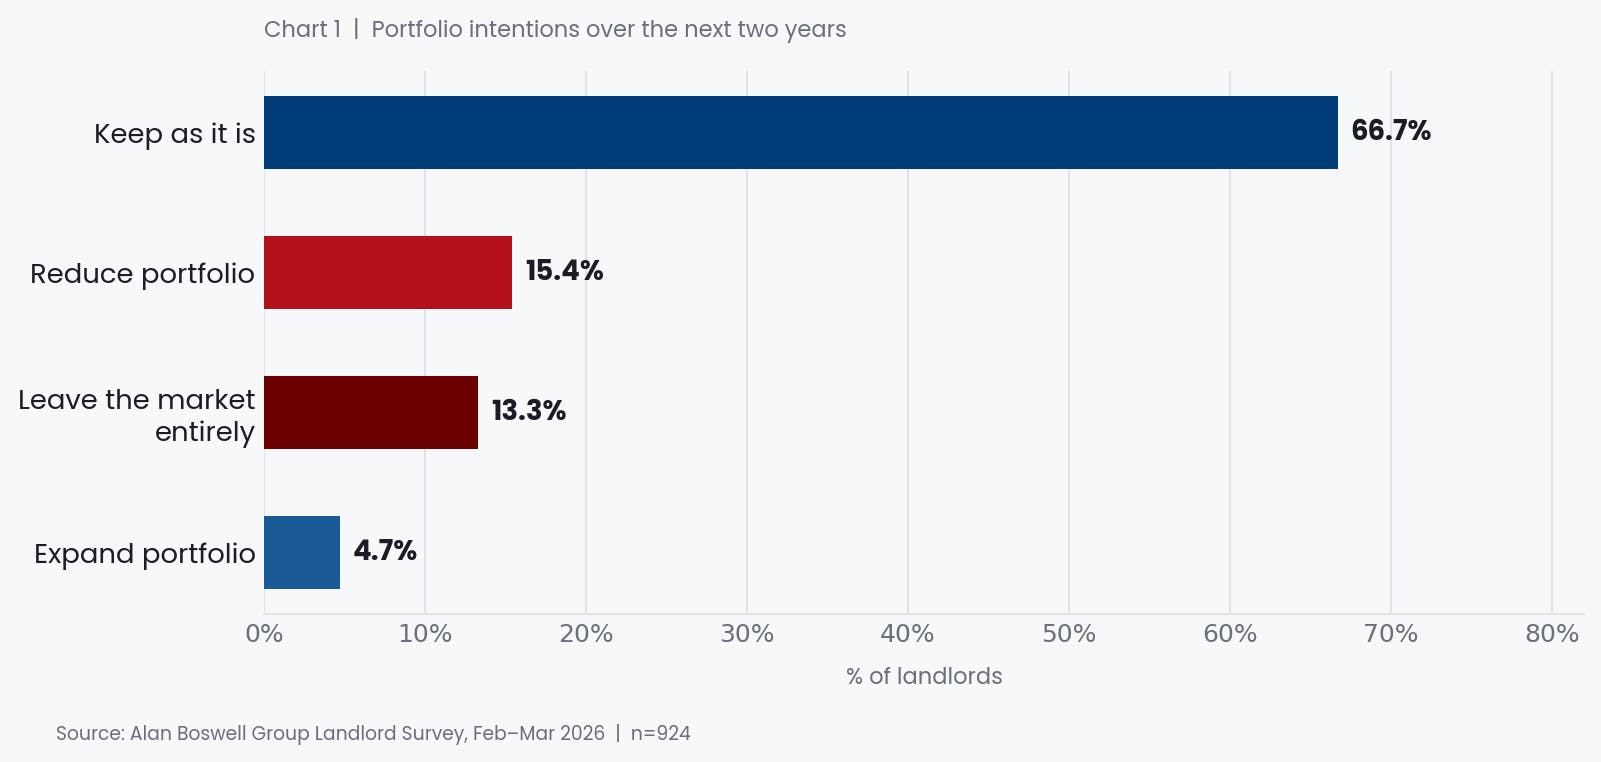
When asked about their intentions for their property portfolio over the next two years, just 5% said they planned to expand. The overwhelming majority, 67%, plan to keep things as they are. But it is the remaining 28% that demands attention: 15% intend to reduce their portfolio, and a further 13% plan to leave the market entirely.
Portfolio intentions over the next two years (% of 924 landlords)
In an already constrained housing market, a withdrawal of stock at this scale, even a partial one, would have meaningful consequences for renters. The private rented sector provides homes for approximately 4.6 million households in England alone. If even a fraction of those signalling an exit follow through, it risks reducing the supply of available rental properties at a time when demand continues to outpace it.
13% of landlords say they plan to leave the market entirely within two years.
A third of landlords are seeing returns fall - yet many are not raising rents
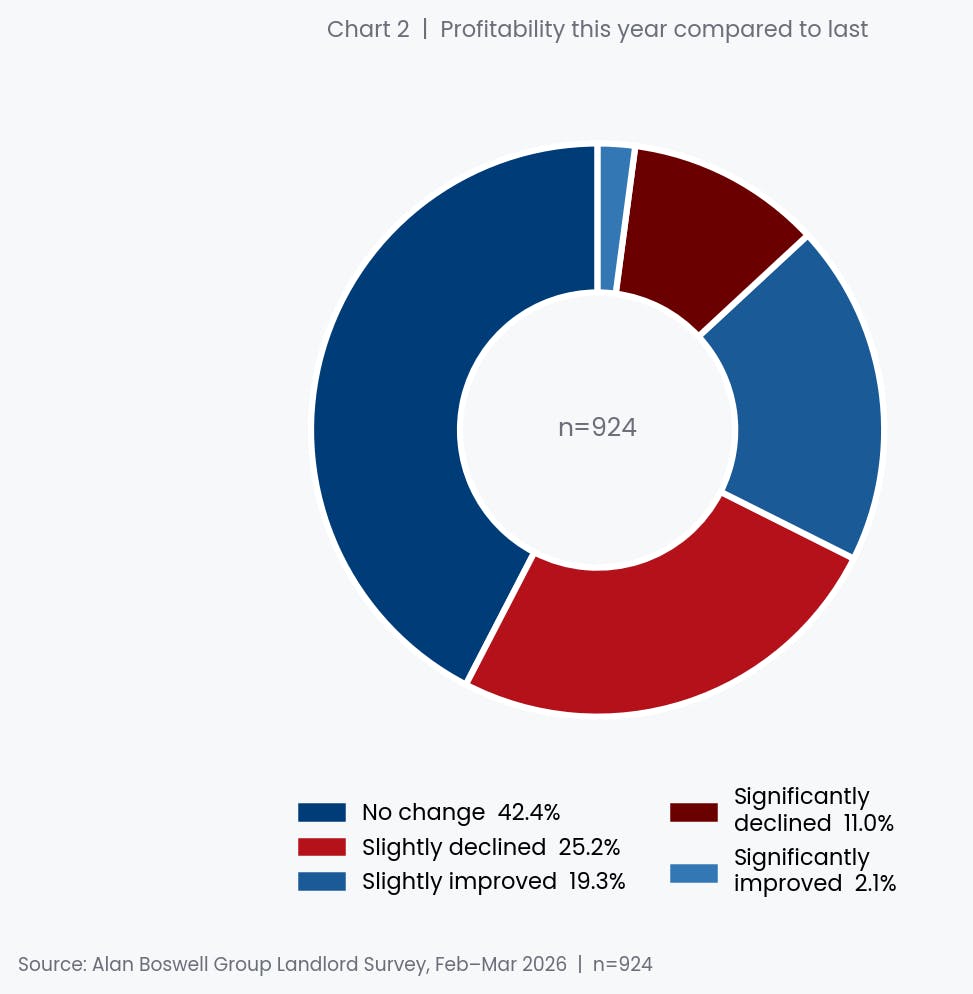
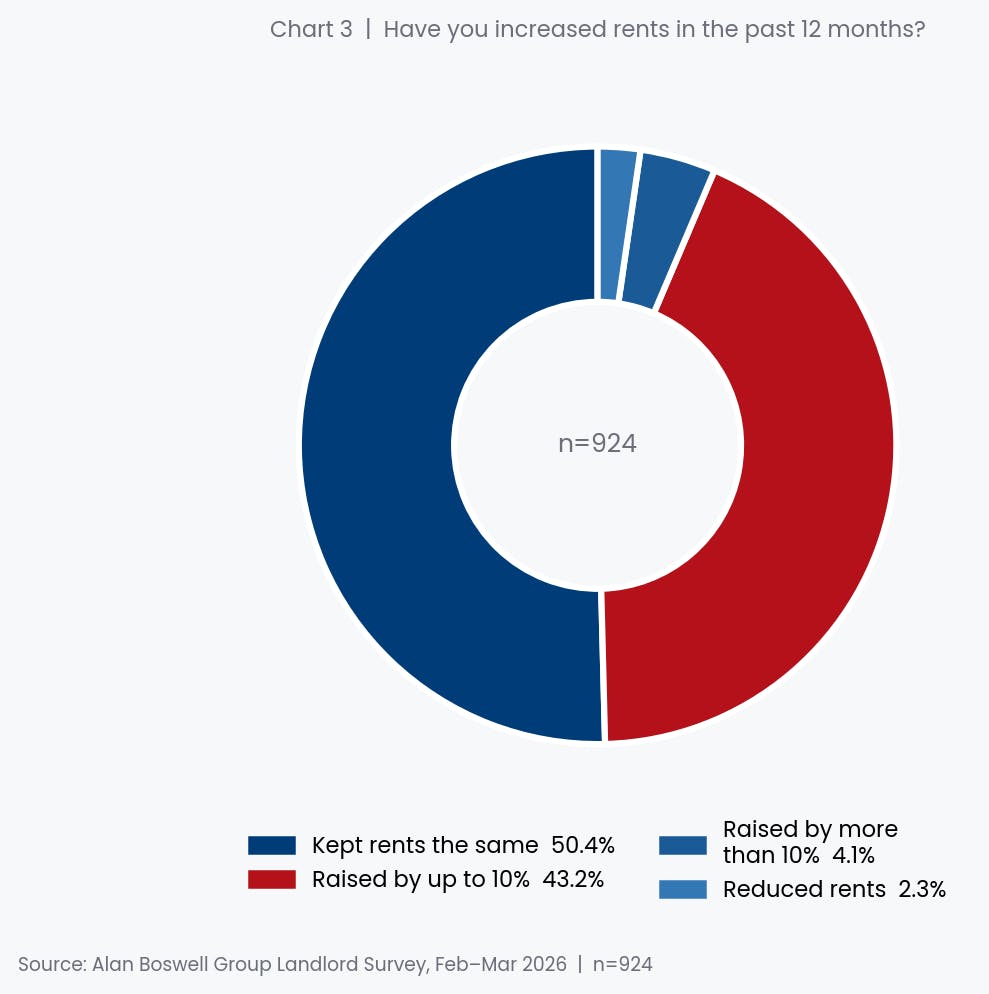
On profitability, the picture is mixed but weighted towards concern. While 42% report no change in profitability year-on-year, a combined 36% say their returns have declined either slightly (25%) or significantly (11%). Only one in five reports any improvement.
Despite declining profitability, half of landlords (50%) kept rents unchanged over the past year. Of those who raised rents, the majority (43% overall) did so by up to 10%, while a smaller 4% raised rents by more than 10%. Just 2% reduced their charges. The decision to raise rents does not appear to be primarily driven by greed: many landlords who stated they increased rents in this survey also reported declining profitability, suggesting they are partly absorbing cost pressures before passing them on.
Legislation is the top challenge by a wide margin
When asked to identify the single most challenging aspect of being a landlord, the responses were unambiguous. More than half (52%) chose legislation changes. This is more than double the second-placed concern, maintenance requests, at 22%. Property damage (8%), tenants not paying rent (7%), and finding tenants (4%) follow at a considerable distance.
The most challenging aspects of being a landlord (% of respondents)
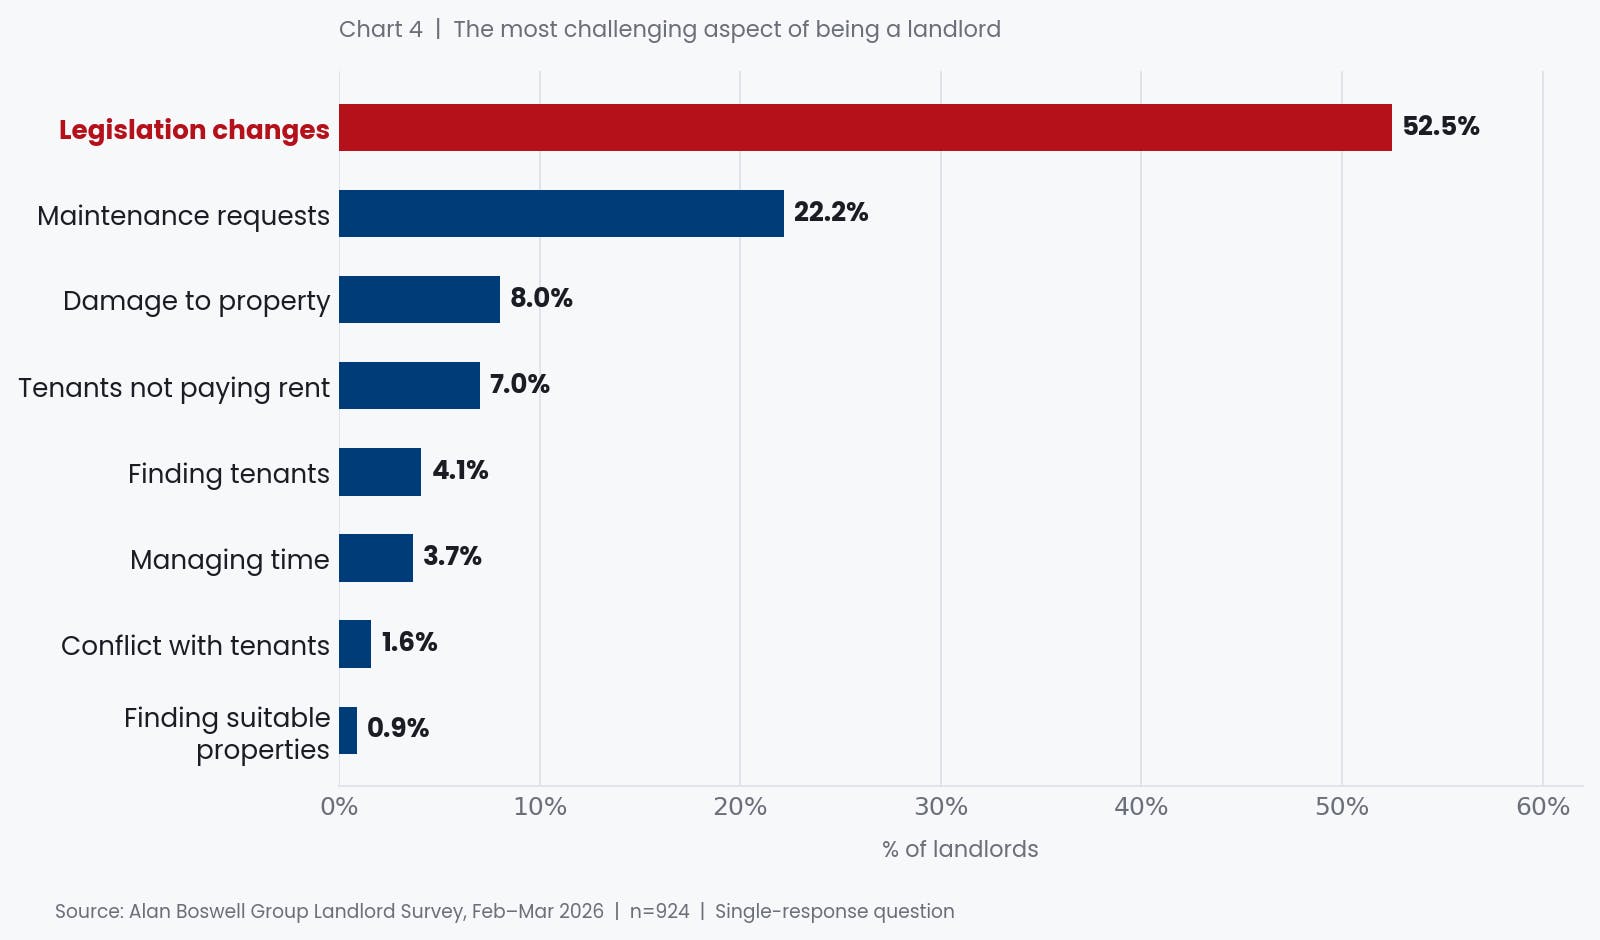
The scale of that legislative concern is impossible to ignore. With the Renters' Rights Act 2025 due to come into effect from May 2026 alongside changes to mortgage interest relief, energy efficiency requirements, and other reforms, landlords are clearly feeling the cumulative weight of regulatory change. Critically, this is not merely a concern of large or professional landlords: single-property owners, who make up 46% of those surveyed, are just as likely to cite it.
The sector is dominated by small-scale, individual landlords
Understanding who landlords are matters when interpreting these findings. The data makes it clear that the private rented sector is not, in the main, run by professional businesses with large portfolios. Nearly half of respondents (46%) own just one property. A further 40% own between two and four. Portfolio landlords, those with five or more properties, account for just 14% of the sample, with those owning ten or more properties representing barely 3%.
Portfolio size: number of properties currently let
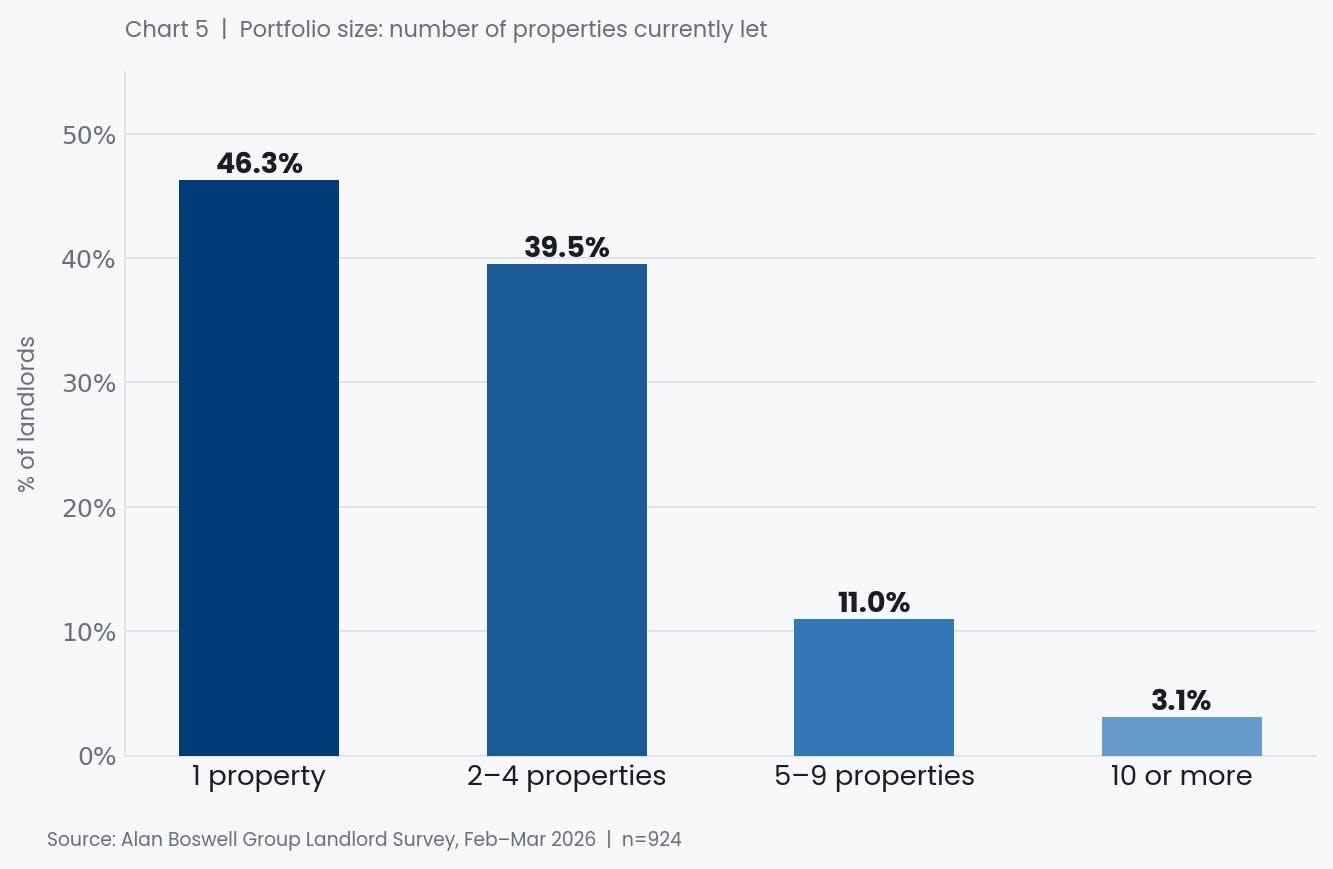
This composition shapes everything: how landlords absorb cost increases, how they engage with legislative change, and how much capacity they have to seek professional advice or invest in compliance. For the majority, being a landlord is not a full-time occupation; it is a secondary income, often tied to a pension strategy or an inherited property, managed alongside other commitments.
Nearly four in ten feel unprepared for incoming regulation
Given that legislation ranks as the sector's foremost challenge, it is particularly notable that a significant proportion of landlords do not feel ready for what is coming. Just 6% describe themselves as highly prepared. A majority (55%) feel adequately prepared, but 31% feel somewhat unprepared, and a further 8% feel significantly unprepared.
How prepared do landlords feel for upcoming regulations? (% of 924 landlords)
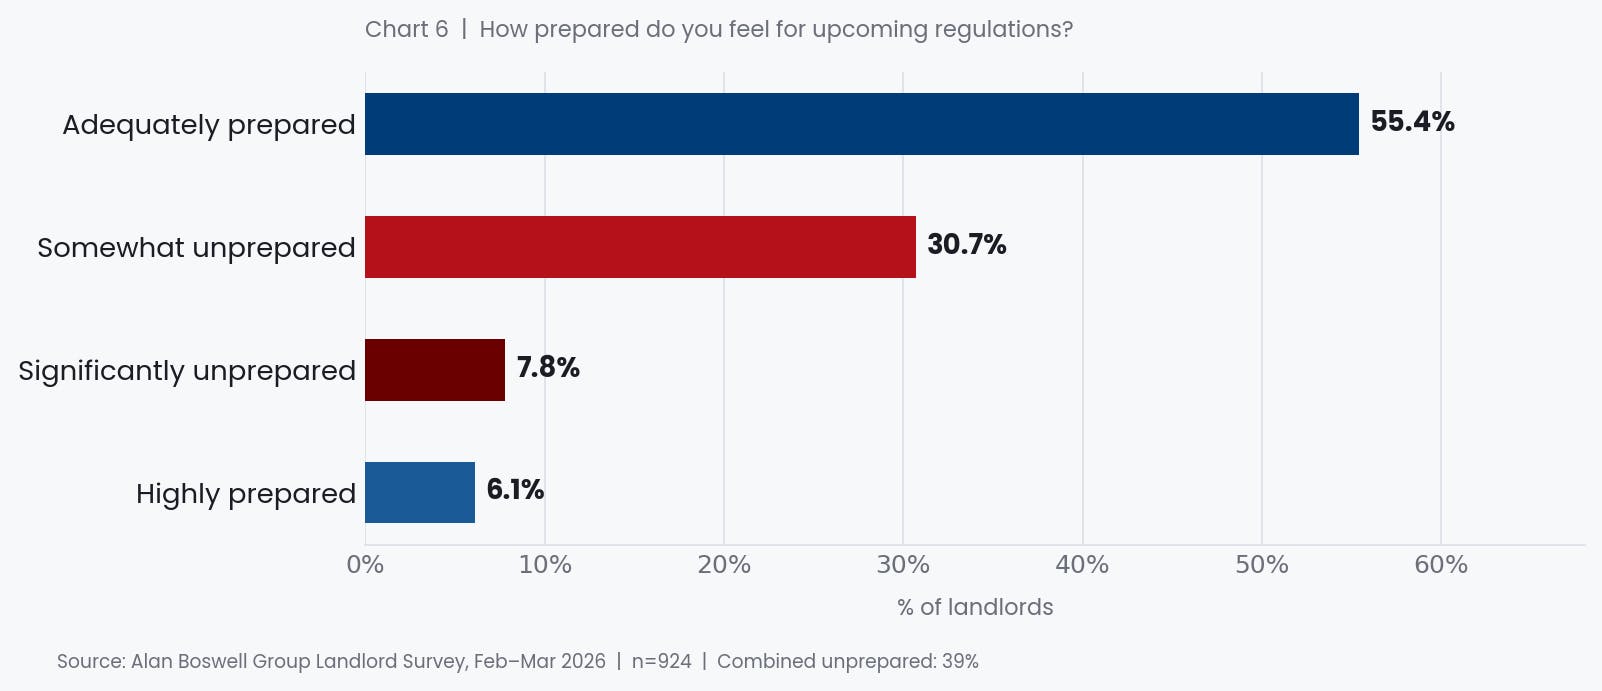
Only 6% of landlords feel highly prepared for the wave of incoming regulation
The figure of nearly 40% of landlords feeling unprepared carries significant implications. A landlord who does not understand or feel equipped to comply with new rules is more likely to make costly mistakes, incur penalties, or simply decide that the risk is not worth taking and exit the market. For organisations working to support landlords through regulatory change, there is an evident and urgent need.
Despite the pressures, tenant relationships are overwhelmingly positive
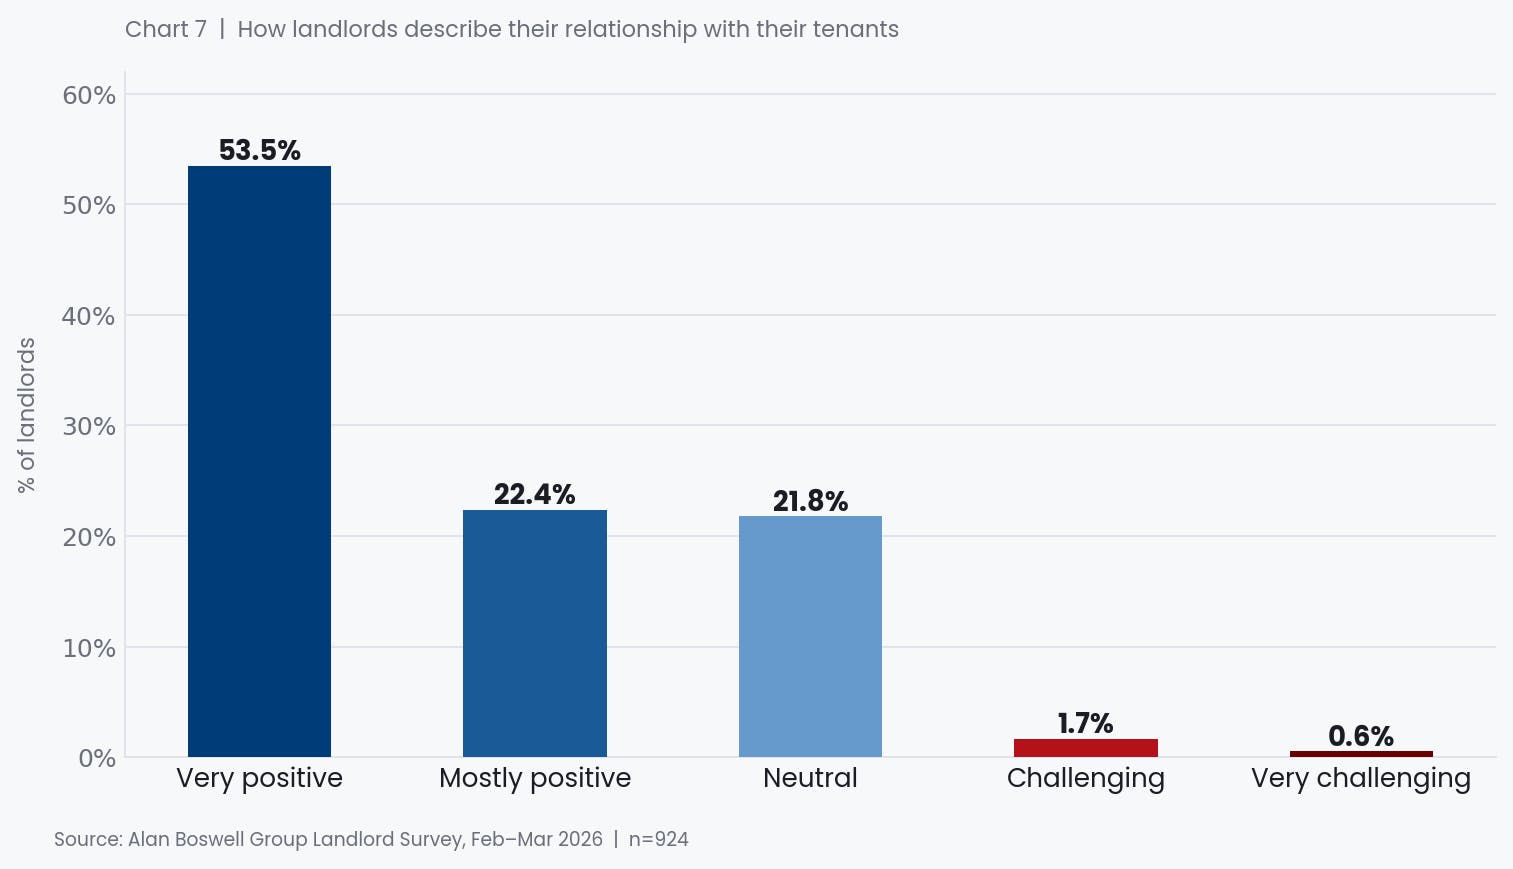
In contrast to some of the more troubling findings above, landlords describe their relationships with tenants in strikingly positive terms. More than half (53%) say they have a very positive relationship with their tenants, and a further 22% describe it as mostly positive, meaning that three in four landlords report actively good relationships. Only 22% are neutral, and just 2% describe their relationship as challenging in any way.
How landlords describe their relationship with their tenants
This finding is worth dwelling on. Much of the public discourse around the private rented sector positions landlords and tenants in adversarial terms. The data here suggests the reality, at least as experienced by landlords, is considerably more collaborative. Whether tenants would characterise their relationships in the same way is a question for a separate study, but the prevalence of positive sentiment on the landlord side is a notable counterpoint to the prevailing narrative.
28% of landlords plan to reduce or exit the market within two years
52% cite legislation changes as their biggest challenge, more than double any other concern
36% of landlords are experiencing declining profitability year-on-year
47% raised rents in the past year, despite half reporting static or declining returns
39% of landlords feel unprepared for upcoming regulations
86% of landlords own fewer than five properties; the sector is driven by individuals, not corporations
75% report a positive or very positive relationship with their tenants
A sector at a crossroads
The data does not tell a story of a sector in crisis, but it does tell the story of a sector under sustained, compounding pressure. The majority of landlords are small-scale operators who value their tenants, are broadly managing to hold their finances together, and, for now, intend to stay. But the signals pointing the other way are significant enough to warrant serious attention.
Legislation is the defining issue. It dominates as the sector's primary challenge, is the driver behind much of the financial anxiety, and is the backdrop against which landlords' intentions regarding their future participation in the market must be understood. The 39% who feel unprepared for what is coming are not an outlier; they are a meaningful segment of a sector whose co-operation is essential to the functioning of the rental market.
The question for policymakers and housing organisations alike is whether the current pace and complexity of regulatory reform can be sustained without further accelerating the exit of the individual landlords on whom renters disproportionately depend.
Landlord insurance FAQs
Whether you need landlord insurance or not will come down to your personal circumstances. Some mortgage lenders will not issue a mortgage unless you have a buy-to-let landlord insurance policy in place beforehand. Even so, landlord insurance can provide you with financial protection should anything go wrong with the property, meaning you are less likely to be out of pocket in the future.
Your monthly landlord insurance costs can vary from as little as £5.66 up to hundreds of pounds per month, depending on the type of property you own, its estimated value, where it is located, and how many bedrooms it has. The monthly cost of your landlord insurance can also be influenced by who is living in the property and the type of occupancy, as well as whether you select any optional extras as part of your policy.
The cost of landlord insurance can vary depending on a number of factors, including location, property type and value, who is occupying the property, as well as any additional extras you select as part of your policy. At a basic level, landlord insurance costs can start from as little as £68 a year, ranging up to thousands of pounds for large, expensive properties.
According to the most recent landlord insurance statistics, the residential landlord insurance market was worth £716.8 million in 2020.
In the UK, the median average cost of landlord insurance in 2026 is £274.18.
Read our report on UK commercial property statistics for even more insights and data.
Related guides and insights

A UK landlord’s checklist
As a property owner you will have far more work to do than many people realise. We've put together an essential landlord checklist to make sure you've got things covered

A guide to short term landlord insurance
Whether you want to let a property on a short-term basis, or you’re hoping to ride the Airbnb wave, our guide to short-term landlord insurance will help make sure you have the right cover for your needs.

A guide to understanding landlord harassment
Landlord harassment is essentially anything a landlord does that prevents tenants from living peacefully in their homes. Examples of landlord harassment in the UK vary widely but includes incidents such as changing the locks without tenants’ knowledge.

Third Which? Best Buy Accolade for Our Landlord Insurance
We're delighted that our landlord insurance has been recognised with a new Which? Best Buy award, backing up previous Which? Best Buy status achieved in 2023 and 2024.